
YARN 排程器是一個肥沃的興趣領域,有不同的實作,例如:Fifo、Capacity 和 Fair 排程器。同時,也進行了多項最佳化,以改善排程器在不同場景和工作負載的效能。每個排程器演算法都有自己的一組功能,並透過許多因素(例如公平性、容量保證、資源可用性等)來驅動排程決策。在我們在生產叢集中部署之前,對排程器演算法進行非常好的評估非常重要。不幸的是,目前評估排程器演算法並非易事。在真實叢集中進行評估總是耗時且耗費成本,而且也很難找到夠大的叢集。因此,一個可以預測排程器演算法對某些特定工作負載的執行情況的模擬器將非常有用。
YARN 排程器負載模擬器 (SLS) 就是這樣一個工具,它可以在單一機器中模擬大規模 YARN 叢集和應用程式負載。這個模擬器對於促進 YARN 來說非常有價值,它為研究人員和開發人員提供了一個工具,可以建置新的排程器功能的原型,並以合理的信心預測它們的行為和效能,從而有助於快速創新。模擬器將使用真實的 YARN ResourceManager,透過在同一個 JVM 中處理和傳送 NM/AM 心跳事件來模擬 NodeManagers 和 ApplicationMasters,從而移除網路因素。為了追蹤排程器的行為和效能,排程器包裝器將包裝真實的排程器。
叢集和應用程式負載的大小可以從組態檔案中載入,這些檔案是透過採用 Apache Rumen 直接從工作記錄檔案產生。
模擬器在執行時會產生即時指標,包括
整個叢集和每個佇列的資源使用情況,可用於設定叢集和佇列的容量。
詳細的應用程式執行追蹤(相對於模擬時間記錄),可用於分析/驗證排程器行為(個別作業的周轉時間、處理量、公平性、容量保證等)。
排程器演算法的幾個關鍵指標,例如每個排程器操作(分配、處理等)的時間成本,Hadoop 開發人員可用於找出程式碼點和可擴充性限制。
使用實際作業追蹤,在沒有實際叢集的情況下,大規模執行排程器。
能夠模擬實際工作負載。
下圖說明模擬器的實作架構。
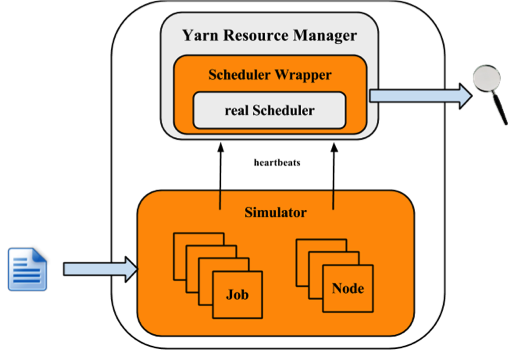
模擬器輸入工作負載追蹤或合成負載分配,並產生叢集和應用程式資訊。對於每個 NM 和 AM,模擬器會建立一個模擬器來模擬它們的執行。所有 NM/AM 模擬器都在執行緒池中執行。模擬器會重複使用 YARN 資源管理員,並在排程器外建立一個封裝器。排程器封裝器可以追蹤排程器行為並產生數個記錄檔,這些記錄檔是模擬器的輸出,可以進一步分析。
工程
QA
解決方案/銷售。
本節將說明如何使用模擬器。在此,讓 $HADOOP_ROOT 代表 Hadoop 安裝目錄。如果您自己建置 Hadoop,則 $HADOOP_ROOT 為 hadoop-dist/target/hadoop-$VERSION。模擬器位於 $HADOOP_ROOT/share/hadoop/tools/sls。sls 資料夾包含四個目錄:bin、html、sample-conf 和 sample-data
bin:包含模擬器的執行指令碼。
html:使用者也可以在離線模式下重現那些即時追蹤圖表。只要將 realtimetrack.json 上傳到 $HADOOP_ROOT/share/hadoop/tools/sls/html/showSimulationTrace.html 即可。對於瀏覽器安全性問題,需要將檔案 realtimetrack.json 和 showSimulationTrace.html 放置在同一個目錄中。
sample-conf:指定模擬器設定檔。
sample-data:提供一個範例的 rumen 追蹤,可用於產生模擬器的輸入。
以下各節將逐步說明如何使用模擬器。在開始之前,請確認指令 hadoop 已包含在您的 $PATH 環境參數中。
在開始之前,請確認 Hadoop 和模擬器已設定妥當。Hadoop 和模擬器的所有設定檔應放置在目錄 $HADOOP_ROOT/etc/hadoop 中,其中 ResourceManager 和 YARN 排程器載入其設定。目錄 $HADOOP_ROOT/share/hadoop/tools/sls/sample-conf/ 提供多個範例設定,可供用於啟動示範。
有關 Hadoop 和 YARN 排程器的設定,使用者可參閱 Yarn 網站 (https://hadoop.dev.org.tw/docs/current/hadoop-yarn/hadoop-yarn-site/).
對於模擬器,它會從檔案 $HADOOP_ROOT/etc/hadoop/sls-runner.xml 載入設定資訊。
在此說明 sls-runner.xml 中的每個設定參數。請注意,$HADOOP_ROOT/share/hadoop/tools/sls/sample-conf/sls-runner.xml 包含這些設定參數的所有預設值。
yarn.sls.runner.pool.size
模擬器使用執行緒池來模擬 NM 和 AM 執行,而此參數指定池中的執行緒數目。
yarn.sls.nm.memory.mb
每個 NMSimulator 的總記憶體。
yarn.sls.nm.vcores
每個 NMSimulator 的總 vCore。
yarn.sls.nm.heartbeat.interval.ms
每個 NMSimulator 的心跳間隔。
yarn.sls.am.heartbeat.interval.ms
每個 AMSimulator 的心跳間隔。
yarn.sls.am.type.mapreduce
類似 MapReduce 應用程式的 AMSimulator 實作。使用者可以為其他類型的應用程式指定實作。
yarn.sls.container.memory.mb
每個容器模擬器所需的記憶體。
yarn.sls.container.vcores
每個容器模擬器所需的 vCore。
yarn.sls.runner.metrics.switch
模擬器引入 指標 來衡量關鍵元件和運作的行為。此欄位指定我們是否開啟 (ON) 或關閉 (OFF) 指標執行。
yarn.sls.metrics.web.address.port
模擬器用於提供即時追蹤的埠。預設值為 10001。
org.apache.hadoop.yarn.server.resourcemanager.scheduler.fifo.FifoScheduler
Fifo 排程器的排程器指標實作。
org.apache.hadoop.yarn.server.resourcemanager.scheduler.fair.FairScheduler
Fair 排程器的排程器指標實作。
org.apache.hadoop.yarn.server.resourcemanager.scheduler.capacity.CapacityScheduler
Capacity Scheduler 的排程器指標實作。
模擬器支援兩種輸入檔案類型:rumen 追蹤和其自有的輸入追蹤。啟動模擬器的指令碼為 slsrun.sh。
$ cd $HADOOP_ROOT/share/hadoop/tools/sls
$ bin/slsrun.sh
  Usage: slsrun.sh <OPTIONS>
             --tracetype=<SYNTH | SLS | RUMEN>
             --tracelocation=<FILE1,FILE2,...>
             (deprecated --input-rumen=<FILE1,FILE2,...>  | --input-sls=<FILE1,FILE2,...>)
             --output-dir=<SLS_SIMULATION_OUTPUT_DIRECTORY>
             [--nodes=<SLS_NODES_FILE>]
             [--track-jobs=<JOBID1,JOBID2,...>]
             [--print-simulation]
--input-rumen:輸入 rumen 追蹤檔案。使用者可以輸入多個檔案,以逗號分隔。一個範例追蹤提供於 $HADOOP_ROOT/share/hadoop/tools/sls/sample-data/2jobs2min-rumen-jh.json。這等於 --tracetype=RUMEN --tracelocation=<path_to_trace>。
--input-sls:模擬器自有的檔案格式。模擬器也提供一個工具,將 rumen 追蹤轉換為 sls 追蹤 (rumen2sls.sh)。請參閱附錄,取得 sls 輸入 json 檔案範例。這等於 --tracetype=SLS --tracelocation=<path_to_trace>。
--tracetype:這是設定追蹤產生的新方式,並採用 RUMEN、SLS 或 SYNTH 等值,以觸發三種類型的負載產生
--tracelocation:輸入檔案路徑,與上述 tracetype 相符。
--output-dir:產生執行記錄檔和指標的輸出目錄。
--nodes:叢集拓撲。預設情況下,模擬器會使用從輸入 json 檔案取得的拓撲。使用者可以透過設定此參數,指定新的拓撲。請參閱附錄,取得拓撲檔案格式。
--track-jobs:模擬器執行期間將追蹤的特定工作,以逗號分隔。
--print-simulation:是否在模擬器執行前列印模擬資訊,包括節點、應用程式、工作數目,以及每個應用程式的資訊。
與 rumen 格式相比,這裡的 sls 格式簡單許多,使用者可以輕鬆產生各種工作負載。模擬器也提供一個工具,將 rumen 追蹤轉換為 sls 追蹤。
$ bin/rumen2sls.sh
  --rumen-file=<RUMEN_FILE>
  --output-dir=<SLS_OUTPUT_DIRECTORY>
    [--output-prefix=<SLS_FILE_PREFIX>]
--rumen-file:rumen 格式檔案。一個範例追蹤提供於 sample-data 目錄中。
--output-dir:產生模擬追蹤的輸出目錄。此輸出目錄中將產生兩個檔案,包括一個包含所有工作和工作資訊的追蹤檔案,以及另一個顯示拓撲資訊的檔案。
--output-prefix:產生檔案的前置詞。預設值為「sls」,兩個產生的檔案為 sls-jobs.json 和 sls-nodes.json。
YARN 排程器負載模擬器已整合 指標 來衡量關鍵元件和作業的行為,包括執行中的應用程式和容器、叢集可用資源、排程器作業時間成本等。如果將開關 yarn.sls.runner.metrics.switch 設為 ON,指標 將執行並將其記錄輸出到使用者指定的 --output-dir 目錄中。使用者可以在模擬器執行期間追蹤這些資訊,也可以在執行後分析這些記錄來評估排程器效能。
模擬器提供一個介面來即時追蹤其執行狀況。使用者可以前往 http://主機:埠號/模擬 來追蹤整個執行狀況,並前往 http://主機:埠號/追蹤 來追蹤特定工作或佇列。這裡的 主機 是我們執行模擬器的地方,而 埠號 是由 yarn.sls.metrics.web.address.port 設定的值 (預設值為 10001)。
我們將說明網頁中顯示的每個圖表。
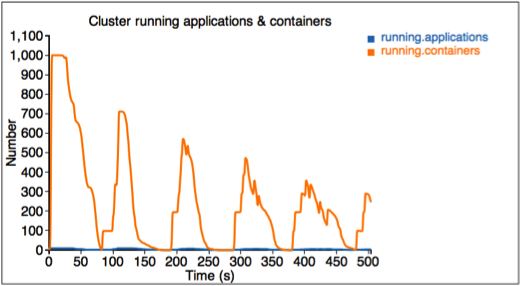
第一個圖形描述執行中應用程式和容器的數量。
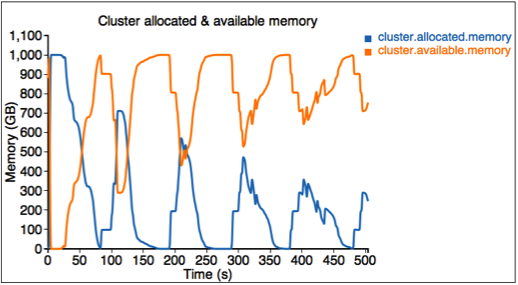
第二個圖形描述叢集中的已配置和可用資源 (記憶體)。
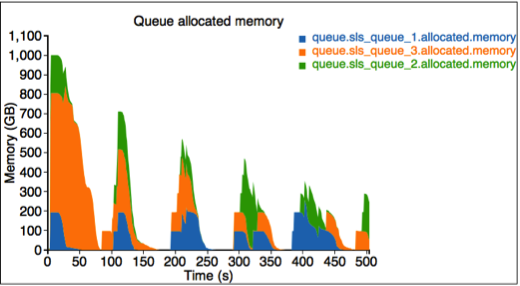
第三個圖形描述每個佇列的已配置資源。這裡有三個佇列:sls_queue_1、sls_queue_2 和 sls_queue_3。前兩個佇列設定為 25% 的共享,而最後一個有 50% 的共享。
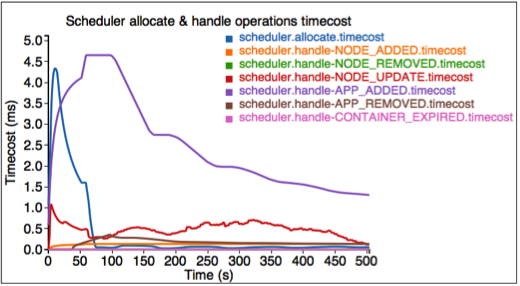
第四個圖形描述每個排程器作業的時間成本。
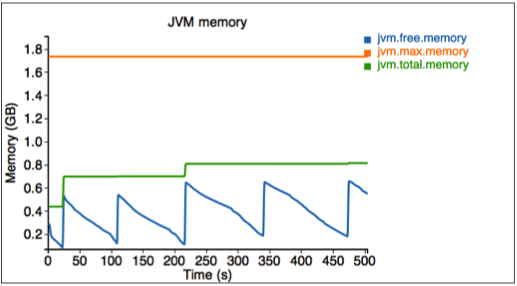
最後,我們衡量模擬器使用的記憶體。
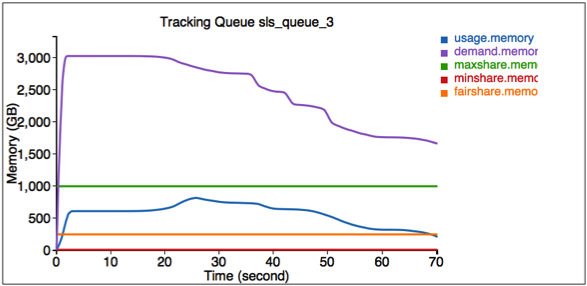
模擬器還提供一個介面來追蹤一些特定工作和佇列。前往 http://<主機>:<埠號>/追蹤 來取得這些資訊。
這裡的第一個圖形說明佇列 SLS_Queue_1 的資源使用資訊。
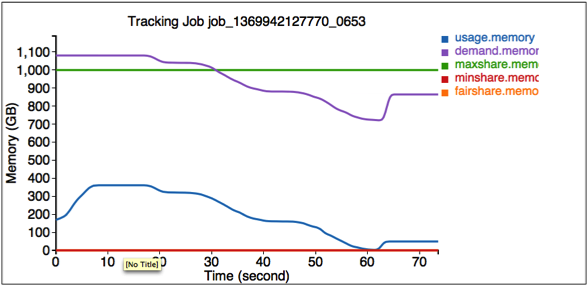
第二個圖形說明工作 job_1369942127770_0653 的資源使用資訊。
模擬器完成後,所有記錄都儲存在 $HADOOP_ROOT/share/hadoop/tools/sls/bin/slsrun.sh 中 --output-dir 指定的輸出目錄中。
檔案 realtimetrack.json:每 1 秒記錄所有即時追蹤記錄。
檔案 jobruntime.csv:記錄模擬器中所有工作的開始和結束時間。
資料夾 指標:由指標產生的記錄。
使用者也可以在離線模式中複製那些即時追蹤圖表。只要將 realtimetrack.json 上傳到 $HADOOP_ROOT/share/hadoop/tools/sls/html/showSimulationTrace.html 即可。由於瀏覽器安全性問題,需要將 realtimetrack.json 和 showSimulationTrace.html 檔案放在同一個目錄中。
合成負載產生器補充了 SLS 原生和 RUMEN 追蹤的廣泛性質,透過提供負載的分配驅動產生。負載產生器組織成 JobStoryProducer(與 rumen 相容,因此 gridmix 可供後續整合)。我們植入亂數產生器,讓結果隨機化但具有決定性,因此可重製。我們將所產生的工作組織在 /workloads/job_class 層級中,這讓我們可以輕鬆地將具有類似行為的工作分組並加以分類(例如,具有長時間執行容器的工作,或僅限 maponly 的運算等)。使用者可以控制許多重要參數的平均值和標準差,例如 mapper/reducer 數量、mapper/reducer 持續時間、容器大小(記憶體/CPU)、保留機會等。當我們從少數選項中挑選時,我們會使用加權隨機抽樣(whenever we pick among a small number of options);當我們從廣泛的數值範圍中挑選時,我們會使用對數常態分配(以避免負值),請參閱對數常態分配的附錄。
SLS 的 SYNTH 模式非常方便,可以在不需要大量輸入檔案的情況下產生非常大的負載。這讓我們可以輕鬆地探索廣泛的用例(例如,想像模擬 100k 個工作,並在不同的執行中調整 mapper 的平均數量或平均工作持續時間),以一種有效且緊湊的方式。
本節說明如何在 SLS 中使用資源類型。
這與為真實叢集設定資源類型的方式相同。將 yarn-site.xml 中的 yarn.resource-types 項目設定為以下範例所示。
 <property>
   <name>yarn.resource-types</name>
   <value>resource-type1, resource-type2</value>
 </property>
透過將相關項目新增至 sls-runner.xml,來指定每個節點中的資源大小,如下面的範例所示。這些值套用至 SLS 中的每個節點。除了記憶體和 vcore 之外的資源的預設值為 0。
 <property>
   <name>yarn.sls.nm.resource-type1</name>
   <value>10</value>
 </property>
 <property>
   <name>yarn.sls.nm.resource-type2</name>
   <value>10</value>
 </property>
SLS JSON 輸入格式支援資源類型,但其他兩種格式(SYNTH 和 RUMEN)不支援。若要讓其在 SLS JSON 輸入格式中運作,您可以為工作容器和 AM 容器指定資源大小。以下是範例。
{
  "job.start.ms" : 0,
  "am.memory-mb": 2048,
  "am.vcores": 2,
  "am.resource-type1": 2,
  "am.resource-type2": 2,
  "job.tasks" : [ {
    "container.duration.ms":  5000
    "container.memory-mb": 1024,
    "container.vcores": 1,
    "container.resource-type1": 1,
    "container.resource-type2": 1
  }
}
YARN-1021 是將 YARN 排程器負載模擬器引入 Hadoop YARN 專案的主要 JIRA。 YARN-6363 是將合成負載產生器引入 SLS 的主要 JIRA。
在此我們提供包含 2 個作業的 sls json 檔案範例格式。第一個作業有 3 個 map 作業,第二個作業有 2 個 map 作業。
{
  "num.nodes": 3,  // total number of nodes in the cluster
  "num.racks": 1   // total number of racks in the cluster, it divides num.nodes into the racks evenly, optional, the default value is 1
}
{
  "am.type" : "mapreduce", // type of AM, optional, the default value is "mapreduce"
  "job.start.ms" : 0,      // job start time
  "job.end.ms" : 95375,    // job finish time, optional, the default value is 0
  "job.queue.name" : "sls_queue_1", // the queue job will be submitted to
  "job.id" : "job_1",      // the job id used to track the job, optional. The default value, an zero-based integer increasing with number of jobs, is used if this is not specified or job.count > 1
  "job.user" : "default",  // user, optional, the default value is "default"
  "job.count" : 1,         // number of jobs, optional, the default value is 1
  "job.tasks" : [ {
    "count": 1,    // number of tasks, optional, the default value is 1
    "container.host" : "/default-rack/node1",  // host the container asks for
    "container.start.ms" : 6664,  // container start time, optional
    "container.end.ms" : 23707,   // container finish time, optional
    "container.duration.ms":  50000, // duration of the container, optional if start and end time is specified
    "container.priority" : 20,    // priority of the container, optional, the default value is 20
    "container.type" : "map"      // type of the container, could be "map" or "reduce", optional, the default value is "map"
  }, {
    "container.host" : "/default-rack/node3",
    "container.start.ms" : 6665,
    "container.end.ms" : 21593,
    "container.priority" : 20,
    "container.type" : "map"
  }, {
    "container.host" : "/default-rack/node2",
    "container.start.ms" : 68770,
    "container.end.ms" : 86613,
    "container.priority" : 20,
    "container.type" : "map"
  } ]
}
{
  "am.type" : "mapreduce",
  "job.start.ms" : 105204,
  "job.end.ms" : 197256,
  "job.queue.name" : "sls_queue_2",
  "job.id" : "job_2",
  "job.user" : "default",
  "job.tasks" : [ {
    "container.host" : "/default-rack/node1",
    "container.start.ms" : 111822,
    "container.end.ms" : 133985,
    "container.priority" : 20,
    "container.type" : "map"
  }, {
    "container.host" : "/default-rack/node2",
    "container.start.ms" : 111788,
    "container.end.ms" : 131377,
    "container.priority" : 20,
    "container.type" : "map"
  } ]
}
在此我們提供合成產生器 json 檔案的範例格式。我們使用(json 非相容) 內嵌註解來說明每個參數的用法。
{
  "description" : "tiny jobs workload",    //description of the meaning of this collection of workloads
  "num_nodes" : 10,  //total nodes in the simulated cluster
  "nodes_per_rack" : 4, //number of nodes in each simulated rack
  "num_jobs" : 10, // total number of jobs being simulated
  "rand_seed" : 2, //the random seed used for deterministic randomized runs

  // a list of “workloads”, each of which has job classes, and temporal properties
  "workloads" : [
    {
      "workload_name" : "tiny-test", // name of the workload
      "workload_weight": 0.5,  // used for weighted random selection of which workload to sample from
      "queue_name" : "sls_queue_1", //queue the job will be submitted to

    //different classes of jobs for this workload
       "job_classes" : [
        {
          "class_name" : "class_1", //name of the class
          "class_weight" : 1.0, //used for weighted random selection of class within workload

          //nextr group controls average and standard deviation of a LogNormal distribution that
          //determines the number of mappers and reducers for thejob.
          "mtasks_avg" : 5,
          "mtasks_stddev" : 1,
          "rtasks_avg" : 5,
          "rtasks_stddev" : 1,

          //averge and stdev input param of LogNormal distribution controlling job duration
          "dur_avg" : 60,
          "dur_stddev" : 5,

          //averge and stdev input param of LogNormal distribution controlling mappers and reducers durations
          "mtime_avg" : 10,
          "mtime_stddev" : 2,
          "rtime_avg" : 20,
          "rtime_stddev" : 4,

          //averge and stdev input param of LogNormal distribution controlling memory and cores for map and reduce
          "map_max_memory_avg" : 1024,
          "map_max_memory_stddev" : 0.001,
          "reduce_max_memory_avg" : 2048,
          "reduce_max_memory_stddev" : 0.001,
          "map_max_vcores_avg" : 1,
          "map_max_vcores_stddev" : 0.001,
          "reduce_max_vcores_avg" : 2,
          "reduce_max_vcores_stddev" : 0.001,

          //probability of running this job with a reservation
          "chance_of_reservation" : 0.5,
          //input parameters of LogNormal distribution that determines the deadline slack (as a multiplier of job duration)
          "deadline_factor_avg" : 10.0,
          "deadline_factor_stddev" : 0.001,
        }
       ],
    // for each workload determines with what probability each time bucket is picked to choose the job starttime.
    // In the example below the jobs have twice as much chance to start in the first minute than in the second minute
    // of simulation, and then zero chance thereafter.
      "time_distribution" : [
        { "time" : 1, "weight" : 66 },
        { "time" : 60, "weight" : 33 },
        { "time" : 120, "jobs" : 0 }
     ]
    }
 ]
}
以下是一個範例輸入拓撲檔案,其中有 3 個節點組織在 1 個機架中。
{
  "rack" : "default-rack",
  "nodes" : [ {
    "node" : "node1"
  }, {
    "node" : "node2"
  }, {
    "node" : "node3"
  }]
}
LogNormal 分配可以很好地表示我們在實務中看到的許多參數 (例如,大多數作業有少數的映射器,但少數可能是非常大的,少數非常小,但大於零。然而值得注意的是,它可能很難使用,因為平均值通常在分配的峰值 (最常見值) 右側,因為分配有一個單側尾部。