
YARN 中透過時序伺服器以一般化的方式儲存和擷取應用程式的目前和歷史資訊。它有兩個責任
收集和擷取完全特定於應用程式或架構的資訊。例如,Hadoop MapReduce 架構可以包含資訊片段,例如映射工作數、縮減工作數、計數器等。應用程式開發人員可以透過應用程式主控程式和/或應用程式的容器中的 TimelineClient 將特定資訊發佈到時序伺服器。
然後,此資訊可透過 REST API 查詢,以供應用程式/架構特定 UI 呈現。
以前,這純粹由應用程式歷程伺服器支援 MapReduce 工作。隨著時序伺服器的推出,應用程式歷程伺服器僅成為時序伺服器的一種用途。
一般資訊包含應用程式層級資料,例如
ApplicationSubmissionContext 中的資訊,YARN 資源管理員會將一般資料發佈到時序儲存,並由其 Web UI 使用,以顯示已完成應用程式的資訊。
目前狀態
未來計畫
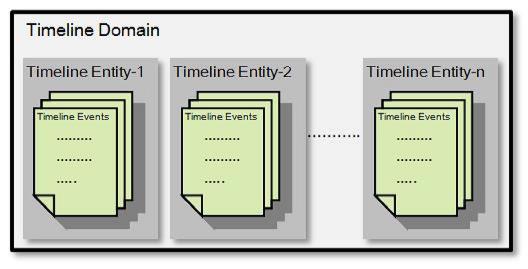
時序網域提供時序伺服器的名稱空間,允許使用者主機多個實體,將它們與其他使用者和應用程式隔離。時序伺服器安全性在此層級定義。
「網域」主要儲存擁有者資訊、讀取和寫入 ACL 資訊、建立和修改時間戳記資訊。每個網域由 ID 識別,此 ID 在 YARN 叢集中的所有使用者之間必須是唯一的。
時間軸實體包含概念實體和相關事件的元資訊。
實體可以是應用程式、應用程式嘗試、容器或任何使用者定義的物件。
它包含將用於在時間軸儲存中索引實體的主要篩選條件。因此,使用者/應用程式應仔細選擇他們想要儲存為主要篩選條件的資訊。
其餘資料可以儲存為未索引資訊。每個實體都由 EntityId 和 EntityType 唯一識別。
時間軸事件描述與應用程式的特定時間軸實體相關的事件。
使用者可以自由定義事件的意義,例如啟動應用程式、配置容器、作業失敗或其他使用者和叢集作業員認為相關的資訊。
| 組態屬性 | 說明 |
|---|---|
yarn.timeline-service.enabled |
在伺服器端,它表示時間軸服務是否已啟用。而在用戶端,使用者可以啟用它來表示用戶端是否要使用時間軸服務。如果在用戶端啟用它並搭配安全性,則 yarn 用戶端會嘗試擷取時間軸伺服器的委派權杖。預設為 false。 |
yarn.resourcemanager.system-metrics-publisher.enabled |
控制 YARN 系統指標是否由 RM 發佈在時間軸伺服器的設定。預設為 false。 |
yarn.timeline-service.generic-application-history.enabled |
指示用戶端是否要從時間軸歷程記錄服務查詢一般應用程式資料。如果未啟用,則僅從資源管理員查詢應用程式資料。預設為 false。 |
| 組態屬性 | 說明 |
|---|---|
yarn.timeline-service.store-class |
時間軸儲存的儲存類別名稱。預設為 org.apache.hadoop.yarn.server.timeline.LeveldbTimelineStore。 |
yarn.timeline-service.leveldb-timeline-store.path |
Leveldb 時間軸儲存的儲存檔名。預設為 ${hadoop.tmp.dir}/yarn/timeline。 |
yarn.timeline-service.leveldb-timeline-store.ttl-interval-ms |
以毫秒為單位,在 leveldb 時序儲存的刪除週期之間等待的時間長度。預設為 300000。 |
yarn.timeline-service.leveldb-timeline-store.read-cache-size |
以位元組為單位,leveldb 時序儲存未壓縮區塊的讀取快取大小。預設為 104857600。 |
yarn.timeline-service.leveldb-timeline-store.start-time-read-cache-size |
leveldb 時序儲存最近讀取的實體開始時間快取大小,以實體數量表示。預設為 10000。 |
yarn.timeline-service.leveldb-timeline-store.start-time-write-cache-size |
leveldb 時序儲存最近寫入的實體開始時間快取大小,以實體數量表示。預設為 10000。 |
yarn.timeline-service.recovery.enabled |
預設為 false。 |
yarn.timeline-service.state-store-class |
時序狀態儲存的儲存類別名稱。預設為 org.apache.hadoop.yarn.server.timeline.recovery.LeveldbTimelineStateStore。 |
yarn.timeline-service.leveldb-state-store.path |
leveldb 時序狀態儲存的儲存檔案名稱。 |
| 組態屬性 | 說明 |
|---|---|
yarn.timeline-service.hostname |
時序服務 Web 應用程式的主機名稱。預設為 0.0.0.0 |
yarn.timeline-service.address |
時序伺服器啟動 RPC 伺服器的地址。預設為 ${yarn.timeline-service.hostname}:10200。 |
yarn.timeline-service.webapp.address |
時序服務 Web 應用程式的 http 地址。預設為 ${yarn.timeline-service.hostname}:8188。 |
yarn.timeline-service.webapp.https.address |
時序服務 Web 應用程式的 https 地址。預設為 ${yarn.timeline-service.hostname}:8190。 |
yarn.timeline-service.bind-host |
伺服器實際繫結的地址。如果設定這個選用的地址,RPC 和 Webapp 伺服器會繫結到這個地址和 yarn.timeline-service.address 和 yarn.timeline-service.webapp.address 中指定的埠。這最常使用於透過設定為 0.0.0.0 來讓服務監聽所有介面。 |
yarn.timeline-service.http-cross-origin.enabled |
針對需要跨來源 Web 回應標頭的 Web 服務啟用跨來源支援 (CORS)。例如,javascript 向時序伺服器提出 Web 服務要求。預設為 false。 |
yarn.timeline-service.http-cross-origin.allowed-origins |
允許的來源清單,以逗號分隔。以 regex: 為字首的值會被解釋為正規表示式。也可以包含萬用字元 (*) 的值,這裡會產生正規表示式,不建議使用,支援僅供向後相容性。預設為 *。 |
yarn.timeline-service.http-cross-origin.allowed-methods |
需要跨來源 (CORS) 支援的網路服務允許使用的方法,以逗號分隔。預設為 GET,POST,HEAD。 |
yarn.timeline-service.http-cross-origin.allowed-headers |
需要跨來源 (CORS) 支援的網路服務允許使用的標頭,以逗號分隔。預設為 X-Requested-With,Content-Type,Accept,Origin。 |
yarn.timeline-service.http-cross-origin.max-age |
需要跨來源 (CORS) 支援的網路服務的預先飛行請求快取秒數。預設為 1800。 |
請注意,HTTP 和 HTTPS 繫結的選擇是在 TimelineClient 中根據 YARN 廣泛設定選項 yarn.http.policy 的值進行的;如果此政策為 HTTPS_ONLY,將選擇 HTTPS 端點。
| 組態屬性 | 說明 |
|---|---|
yarn.timeline-service.ttl-enable |
啟用刪除時序儲存中過期的資料。預設為 true。 |
yarn.timeline-service.ttl-ms |
時序儲存資料的生存時間(毫秒)。預設為 604800000(7 天)。 |
yarn.timeline-service.handler-thread-count |
處理執行緒數量,用於提供客戶端 RPC 要求。預設為 10。 |
yarn.timeline-service.client.max-retries |
嘗試發佈資料到時序服務的最大重試次數。預設為 30。 |
yarn.timeline-service.client.retry-interval-ms |
時序服務客戶端重試之間的毫秒間隔。預設為 1000。 |
yarn.timeline-service.generic-application-history.max-applications |
使用 REST API 或應用程式歷程記錄協定擷取的最大應用程式數量,並顯示在時序伺服器網路使用者介面中。預設為 10000。 |
如果啟用,時序服務可以主機多個 UI。此服務可以支援目錄中主機的靜態網站或捆綁的 war 檔案。然後,網路 UI 會在已設定路徑下的時序服務 HTTP 埠上主機。
| 組態屬性 | 說明 |
|---|---|
yarn.timeline-service.ui-names |
將主機的 UI 清單,以逗號分隔。預設為 none。 |
yarn.timeline-service.ui-on-disk-path.$name |
對於每個 ui-names,應該指定一個磁碟路徑到目錄服務靜態內容或網路檔案 (war 檔案) 的位置。 |
yarn.timeline-service.ui-web-path.$name |
對於每個 ui-names,應該相對於時序伺服器根目錄指定網路路徑。路徑應該以斜線開頭。 |
設定 yarn.timeline-service.http-authentication.type 為 kerberos 可啟用安全性,之後可使用下列組態選項
| 組態屬性 | 說明 |
|---|---|
yarn.timeline-service.http-authentication.type |
定義時間軸伺服器 HTTP 端點所使用的驗證。支援的值為:simple / kerberos / #AUTHENTICATION_HANDLER_CLASSNAME#。預設為 simple。 |
yarn.timeline-service.http-authentication.simple.anonymous.allowed |
指示使用「simple」驗證時,時間軸伺服器是否允許匿名要求。預設為 true。 |
yarn.timeline-service.principal |
時間軸伺服器的 Kerberos 主體。 |
yarn.timeline-service.keytab |
時間軸伺服器的 Kerberos keytab。Unix 上預設為 /etc/krb5.keytab。 |
yarn.timeline-service.delegation.key.update-interval |
預設為 86400000(1 天)。 |
yarn.timeline-service.delegation.token.renew-interval |
預設為 86400000(1 天)。 |
yarn.timeline-service.delegation.token.max-lifetime |
預設為 604800000(7 天)。 |
yarn.timeline-service.client.best-effort |
取得委派權杖失敗是否應視為應用程式失敗(選項 = false),或客戶端是否應嘗試繼續在沒有權杖的情況下發布資訊(選項 = true)。預設:false |
以下是啟動時間軸伺服器的基本組態。
<property>
  <description>Indicate to clients whether Timeline service is enabled or not.
  If enabled, the TimelineClient library used by end-users will post entities
  and events to the Timeline server.</description>
  <name>yarn.timeline-service.enabled</name>
  <value>true</value>
</property>

<property>
  <description>The setting that controls whether yarn system metrics is
  published on the timeline server or not by RM.</description>
  <name>yarn.resourcemanager.system-metrics-publisher.enabled</name>
  <value>true</value>
</property>

<property>
  <description>Indicate to clients whether to query generic application
  data from timeline history-service or not. If not enabled then application
  data is queried only from Resource Manager.</description>
  <name>yarn.timeline-service.generic-application-history.enabled</name>
  <value>true</value>
</property>
假設所有上述組態都設定正確,管理員可以使用下列指令啟動時間軸伺服器/歷程服務
yarn timelineserver
若要以守護程式身分啟動時間軸伺服器/歷程服務,指令為
$HADOOP_YARN_HOME/sbin/yarn-daemon.sh start timelineserver
使用者可以透過下列命令列存取應用程式的歷程一般資料
$ yarn application -status <Application ID>
$ yarn applicationattempt -list <Application ID>
$ yarn applicationattempt -status <Application Attempt ID>
$ yarn container -list <Application Attempt ID>
$ yarn container -status <Container ID>
請注意,相同的指令可用於取得正在執行應用程式的對應資訊。
開發人員可以透過建構 TimelineEntity 和 TimelineEvent 物件,然後透過 TimelineClient API 將實體和事件發布到時間軸伺服器,來定義他們想要為應用程式記錄哪些資訊。
以下是一個範例
// Create and start the Timeline client
TimelineClient client = TimelineClient.createTimelineClient();
client.init(conf);
client.start();

try {
  TimelineDomain myDomain = new TimelineDomain();
  myDomain.setId("MyDomain");
  // Compose other Domain info ....

  client.putDomain(myDomain);

  TimelineEntity myEntity = new TimelineEntity();
  myEntity.setDomainId(myDomain.getId());
  myEntity.setEntityType("APPLICATION");
  myEntity.setEntityId("MyApp1");
  // Compose other entity info

  TimelinePutResponse response = client.putEntities(entity);

  TimelineEvent event = new TimelineEvent();
  event.setEventType("APP_FINISHED");
  event.setTimestamp(System.currentTimeMillis());
  event.addEventInfo("Exit Status", "SUCCESS");
  // Compose other Event info ....

  myEntity.addEvent(event);
  TimelinePutResponse response = timelineClient.putEntities(entity);

} catch (IOException e) {
  // Handle the exception
} catch (RuntimeException e) {
  // In Hadoop 2.6, if attempts submit information to the Timeline Server fail more than the retry limit,
  // a RuntimeException will be raised. This may change in future releases, being
  // replaced with a IOException that is (or wraps) that which triggered retry failures.
} catch (YarnException e) {
  // Handle the exception
} finally {
  // Stop the Timeline client
  client.stop();
}
TimelineClient 實作類別是 YARN Service API 的子類別;它可以置於 CompositeService 下,以簡化其生命週期管理。putEntities() 呼叫的結果是一個 TimelinePutResponse 物件。這包含時間軸伺服器拒絕的那些時間軸實體的清單(希望是空的),以及指示每個失敗原因的錯誤碼。在 Hadoop 2.6 和 2.7 中,錯誤代碼為
| 錯誤代碼 | 說明 |
|---|---|
| 1 | 沒有開始時間 |
| 2 | IOException |
| 3 | 系統篩選器衝突(已使用保留篩選器金鑰) |
| 4 | 拒絕存取 |
| 5 | 沒有網域 |
| 6 | 禁止的關聯 |
未來可能會定義更多錯誤代碼。
注意:以下是更新實體時需要遵守的幾點事項。
使用者可透過 Web UI 存取應用程式的通用歷程資訊
http(s)://<timeline server http(s) address:port>/applicationhistory
目前僅透過 REST API 呼叫支援查詢時間軸伺服器;YARN 函式庫中未實作 API 程式碼。在 Java 中,Jersey 程式碼可有效查詢伺服器,即使在安全模式下(前提是呼叫者擁有適當的 Kerberos 權杖或 keytab)。
v1 REST API 在時間軸伺服器網路服務的 /ws/v1/timeline/ 路徑下實作。
以下是 API 的非規範說明。
GET /ws/v1/timeline/
傳回描述伺服器執行個體和版本資訊的 JSON 物件。
 {
   About: "Timeline API",
   timeline-service-version: "3.0.0-SNAPSHOT",
   timeline-service-build-version: "3.0.0-SNAPSHOT from fcd0702c10ce574b887280476aba63d6682d5271 by zshen source checksum e9ec74ea3ff7bc9f3d35e9cac694fb",
   timeline-service-version-built-on: "2015-05-13T19:45Z",
   hadoop-version: "3.0.0-SNAPSHOT",
   hadoop-build-version: "3.0.0-SNAPSHOT from fcd0702c10ce574b887280476aba63d6682d5271 by zshen source checksum 95874b192923b43cdb96a6e483afd60",
   hadoop-version-built-on: "2015-05-13T19:44Z"
 }
/ws/v1/timeline/domain/ws/v1/timeline/domainGET /ws/v1/timeline/domain?owner=$OWNER
傳回屬於特定使用者的網域清單,採用 JSON 封送的 TimelineDomains 資料結構。
未驗證身分的 GET 請求中,必須設定 owner。
在驗證身分的請求中,owner 預設為呼叫者。
PUT /ws/v1/timeline/domain
將序列化 TimelineDomain 結構的 PUT 請求傳送至這個路徑,會將網域新增到指定/目前使用者擁有的網域清單中。成功的操作會傳回狀態碼 200 和不含錯誤的 TimelinePutResponse。
/ws/v1/timeline/domain/{domainId}傳回描述網域的 JSON 封送 TimelineDomain 結構。
如果找不到網域,則傳回 HTTP 404 回應。
/ws/v1/timeline/domain建立新的時序網域,或覆寫現有的網域。
嘗試建立新網域時,提交中的 ID 在叢集中的所有網域中都必須是唯一的。
嘗試更新現有的網域時,必須設定該網域的 ID。提交者必須具有適當的權限才能更新網域。
提交:TimelineDomain
回應:TimelinePutResponse
/ws/v1/timeline/domain擷取使用者的所有網域清單。
如果指定了擁有者,該擁有者名稱會覆寫呼叫者的名稱。
| 查詢參數 | 說明 |
|---|---|
擁有者 |
要列出的網域擁有者 |
GET https://127.0.0.1:8188/ws/v1/timeline/domain?owner=alice

{
"domains":
  [
    {
    "id":"DS_DOMAIN_2",
    "owner":"alice",
    "readers":"peter",
    "writers":"john",
    "createdtime":1430425000337,
    "modifiedtime":1430425000337
    },
    {
    "id":"DS_DOMAIN_1",
    "owner":"alice",
    "readers":"bar",
    "writers":"foo",
    "createdtime":1430424955963,
    "modifiedtime":1430424955963
    }
    ,
    {"id":"DEFAULT",
    "description":"System Default Domain",
    "owner":"alice",
    "readers":"*",
    "writers":"*",
    "createdtime":1430424022699,
    "modifiedtime":1430424022699
    }
  ]
}
回應:TimelineDomains
如果使用者沒有列出指定擁有者網域的權限,則會傳回不含任何網域清單的 TimelineDomains 回應。
/ws/v1/timeline/domain/{domainId}擷取單一網域的詳細資料
GET https://127.0.0.1:8188/ws/v1/timeline/domain/DS_DOMAIN_1
回應:TimelineDomain
{
  "id":"DS_DOMAIN_1",
  "owner":"zshen",
  "readers":"bar",
  "writers":"foo",
  "createdtime":1430424955963,
  "modifiedtime":1430424955963
}
如果使用者沒有查詢該網域詳細資料的權限,則會傳回 404 找不到例外狀況,這與沒有符合該 ID 的項目時傳回的回應相同。
透過張貼實體 API,您可以將包含您想要記錄的每個架構資訊的實體和事件張貼到時序伺服器。
http(s)://<timeline server http(s) address:port>/ws/v1/timeline
POST
無
TimelinePutResponseHTTP 要求
POST http://<timeline server http address:port>/ws/v1/timeline
要求標頭
POST /ws/v1/timeline HTTP/1.1
Accept: application/json
Content-Type: application/json
Transfer-Encoding: chunked
要求主體
{
  "entities" : [ {
    "entity" : "entity id 0",
    "entitytype" : "entity type 0",
    "relatedentities" : {
      "test ref type 2" : [ "test ref id 2" ],
      "test ref type 1" : [ "test ref id 1" ]
    },
    "events" : [ {
      "timestamp" : 1395818851590,
      "eventtype" : "event type 0",
      "eventinfo" : {
        "key2" : "val2",
        "key1" : "val1"
      }
    }, {
      "timestamp" : 1395818851590,
      "eventtype" : "event type 1",
      "eventinfo" : {
        "key2" : "val2",
        "key1" : "val1"
      }
    } ],
    "primaryfilters" : {
      "pkey2" : [ "pval2" ],
      "pkey1" : [ "pval1" ]
    },
    "otherinfo" : {
      "okey2" : "oval2",
      "okey1" : "oval1"
    },
    "starttime" : 1395818851588
  }, {
    "entity" : "entity id 1",
    "entitytype" : "entity type 0",
    "relatedentities" : {
      "test ref type 2" : [ "test ref id 2" ],
      "test ref type 1" : [ "test ref id 1" ]
    },
    "events" : [ {
      "timestamp" : 1395818851590,
      "eventtype" : "event type 0",
      "eventinfo" : {
        "key2" : "val2",
        "key1" : "val1"
      }
    }, {
      "timestamp" : 1395818851590,
      "eventtype" : "event type 1",
      "eventinfo" : {
        "key2" : "val2",
        "key1" : "val1"
      }
    } ],
    "primaryfilters" : {
      "pkey2" : [ "pval2" ],
      "pkey1" : [ "pval1" ]
    },
    "otherinfo" : {
      "okey2" : "oval2",
      "okey1" : "oval1"
    },
    "starttime" : 1395818851590
  } ]
}
必填欄位
實體:type 和 id。除非實體包含一個或多個事件,否則需要 starttime。事件:type 和 timestamp。
使用時序實體清單 API,您可以擷取實體物件清單,依實體的開始時間戳記遞減排序。實體的開始時間戳記可以是應用程式指定的時間戳記。如果未明確指定,系統會選擇儲存體中第一個實體貼文的事件最早時間戳記。
使用下列 URI 取得特定 entityType 的所有實體物件。
http(s)://<timeline server http(s) address:port>/ws/v1/timeline/{entityType}
GET
limit - 傳回實體數量的限制。如果為 null,預設為 100。windowStart - 擷取最早的開始時間戳記(不含)。如果為 null,預設為擷取所有實體,直到達到限制。windowEnd - 擷取最新的開始時間戳記(含)。如果為 null,預設為 Long 的最大值。fromId - 如果 fromId 不為 null,擷取早於或等於指定 ID 的實體。如果找不到指定 ID 的開始時間,將傳回空的實體清單。如果此實體的開始時間晚於 windowEnd,windowEnd 參數將優先。fromTs - 如果 fromTs 不為 null,忽略在給定時間戳記之後插入儲存體的實體。用於此比較的實體插入時間戳記是收到實體的第一個放置時間(非實體的開始時間)時的儲存體系統時間。primaryFilter - 僅擷取具有指定主要篩選器的實體。如果為 null,擷取所有實體。這是一種索引化擷取,不會掃描與篩選器不符的實體。secondaryFilters - 僅擷取在主要篩選器或其他資訊中與所有指定篩選器完全相符的實體。這不是索引化擷取,因此會掃描所有實體,但只傳回與篩選器相符的實體。EVENTS、RELATED_ENTITIES、PRIMARY_FILTERS、OTHER_INFO、LAST_EVENT_ONLY。如果欄位組包含 LAST_EVENT_ONLY 但不包含 EVENTS,將擷取每個實體的最新事件。如果為 null,擷取所有欄位。請注意,primaryFilter 和 secondaryFilters 參數的 key/value 成對值可以是不同的資料類型,而且比對會區分資料類型。使用者需要正確格式化值。例如,123 和 "123" 分別表示整數和字串。如果實體的 primaryFilter 有字串 "123",但參數設定為整數 123,將不會比對到實體。同樣地,true 表示布林值,而 "true" 表示字串。一般來說,值會根據 jackson 程式庫剖析 JSON 剪輯的方式,轉型為特定的 Java 類型。
entities (時序實體清單) 物件的元素當您提出時間軸實體清單的要求時,資訊將以容器物件的集合形式傳回。另請參閱時間軸實體以了解時間軸實體物件的語法。
| 項目 | 資料類型 | 說明 |
|---|---|---|
entities |
時間軸實體物件陣列 (JSON) | 時間軸實體物件的集合 |
HTTP 要求
GET https://127.0.0.1:8188/ws/v1/timeline/DS_APP_ATTEMPT
回應標頭
HTTP/1.1 200 OK
Content-Type: application/json
Transfer-Encoding: chunked
回應本文
{
  "entities":[
  {
  "entitytype":"DS_APP_ATTEMPT",
  "entity":"appattempt_1430424020775_0004_000001",
  "events":[
    {
    "timestamp":1430425008796,
    "eventtype":"DS_APP_ATTEMPT_END",
    "eventinfo": { }
    }
    {
    "timestamp":1430425004161,
    "eventtype":"DS_APP_ATTEMPT_START",
    "eventinfo": { }
    }
  ]
  "starttime":1430425004161,
  "domain":"DS_DOMAIN_2",
  "relatedentities": { },
  "primaryfilters":
    {
    "user":["zshen"]
    },
  "otherinfo": { }
  }
  {
  "entitytype":"DS_APP_ATTEMPT",
  "entity":"appattempt_1430424020775_0003_000001",
  "starttime":1430424959169,
  "domain":"DS_DOMAIN_1",
  "events":[
    {
    "timestamp":1430424963836,
    "eventinfo": { }
     }
    {
    "timestamp":1430424959169,
    "eventinfo": { }
    }
   ]
  "relatedentities": { },
  "primaryfilters": {
    "user":["zshen"]
   },
  "otherinfo": { }
   }
  ]
}
透過時間軸實體 API,您可以擷取特定實體識別碼的實體資訊。
使用下列 URI 取得由 entityType 值和 entityId 值識別的實體物件。
http(s)://<timeline server http(s) address:port>/ws/v1/timeline/{entityType}/{entityId}
GET
EVENTS、RELATED_ENTITIES、PRIMARY_FILTERS、OTHER_INFO、LAST_EVENT_ONLY。如果欄位組包含 LAST_EVENT_ONLY 但不包含 EVENTS,則會擷取每個實體的最新事件。如果為 null,則會擷取所有欄位。entity (時間軸實體) 物件的元素另請參閱時間軸事件清單以了解時間軸事件物件的語法。請注意,primaryfilters 和 otherinfo 的 value 是物件,而非字串。
| 項目 | 資料類型 | 說明 |
|---|---|---|
entity |
字串 | 實體 ID |
entitytype |
字串 | 實體類型 |
relatedentities |
對應 | 相關實體的識別碼,以 entityType : [entity1, entity2, …] 的對應方式組織。 |
events |
清單 | 實體的事件 |
primaryfilters |
對應 | 實體的主要篩選條件,以 key : [value1, value2, …] 的對應方式組織。 |
otherinfo |
對應 | 實體的其他資訊,以 key : value 的對應方式組織。 |
starttime |
長整數 | 實體的開始時間 |
HTTP 要求
GET https://127.0.0.1:8188/ws/v1/timeline/DS_APP_ATTEMPT/appattempt_1430424020775_0003_000001
回應標頭
HTTP/1.1 200 OK
Content-Type: application/json
Transfer-Encoding: chunked
回應本文
{
  "events":[
    {
    "timestamp":1430424959169,
    "eventtype":"DS_APP_ATTEMPT_START",
    "eventinfo":  {}}],
    "entitytype":"DS_APP_ATTEMPT",
    "entity":"appattempt_1430424020775_0003_000001",
    "starttime":1430424959169,
    "domain":"DS_DOMAIN_1",
    "relatedentities":  {},
    "primaryfilters":  {
        "user":["zshen"]
        },
    "otherinfo":  {}
    }
  ]
}
透過時間軸事件 API,您可以擷取所有相同實體類型的實體清單的事件物件。每個實體的事件會依時間戳記遞減排序。
使用下列 URI 取得特定 entityType 的事件物件。
http(s)://<timeline server http(s) address:port>/ws/v1/timeline/{entityType}/events
GET
entityId - 要擷取事件的實體 ID。如果為 null,則不會傳回任何事件。多個 entityId 可以使用逗號分隔的值提供。limit - 對每個實體傳回的事件數量限制。如果為 null,則預設每個實體傳回 100 個事件。windowStart - 如果不為 null,則只會擷取晚於指定時間 (不含) 的事件windowEnd - 如果不為空值,則僅擷取早於指定時間(包含)的事件eventType - 將傳回的事件限制為指定的類型。如果為空值,則傳回所有類型的事件。多個事件類型可以用逗號分隔的值表示。events (時間軸實體清單) 物件的元素當您提出時間軸事件清單的要求時,資訊會以事件物件集合的形式傳回。
| 項目 | 資料類型 | 說明 |
|---|---|---|
events |
時間軸事件物件陣列 (JSON) | 時間軸事件物件集合 |
以下是單一事件物件的元素。請注意,eventinfo 和 otherinfo 的 value 是物件,而不是字串。
| 項目 | 資料類型 | 說明 |
|---|---|---|
eventtype |
字串 | 事件類型 |
eventinfo |
對應 | 事件資訊,以 key : value 的對應方式組織在對應中 |
timestamp |
長整數 | 事件的時間戳記 |
HTTP 要求
GET https://127.0.0.1:8188/ws/v1/timeline/DS_APP_ATTEMPT/events?entityId=appattempt_1430424020775_0003_000001
回應標頭
HTTP/1.1 200 OK
Content-Type: application/json
Transfer-Encoding: chunked
回應本文
{
"events": [
  {
  "entity":"appattempt_1430424020775_0003_000001",
  "entitytype":"DS_APP_ATTEMPT"}
  "events":[
    {
    "timestamp":1430424963836,
    "eventtype":"DS_APP_ATTEMPT_END",
    "eventinfo":{}},
    {
    "timestamp":1430424959169,
    "eventtype":"DS_APP_ATTEMPT_START",
    "eventinfo":{}}
    ],
   }
  ]
}
使用者可以透過 REST API 存取應用程式的一般歷程資訊。
使用 about API,您可以取得關於資源的時間軸,其中包含一般歷程 REST API 說明和版本資訊。
它基本上是 YARN TimelineAbout 結構的 XML/JSON 序列化形式。
使用下列 URI 取得關於物件的時間軸。
http(s)://<timeline server http(s) address:port>/ws/v1/applicationhistory/about
GET
無
about (應用程式) 物件的元素| 項目 | 資料類型 | 說明 |
|---|---|---|
關於 |
字串 | 服務說明 |
timeline-service-version |
字串 | 時間軸服務版本 |
timeline-service-build-version |
字串 | 時間軸服務建置版本 |
timeline-service-version-built-on |
字串 | 時間軸服務建置時間 |
hadoop-version |
字串 | Hadoop 版本 |
hadoop-build-version |
字串 | Hadoop 建置版本 |
hadoop-version-built-on |
字串 | Hadoop 建置時間 |
HTTP 要求
https://127.0.0.1:8188/ws/v1/applicationhistory/about
回應標頭
HTTP/1.1 200 OK
Content-Type: application/json
Transfer-Encoding: chunked
回應本文
{
  About: "Generic History Service API",
  timeline-service-version: "3.0.0-SNAPSHOT",
  timeline-service-build-version: "3.0.0-SNAPSHOT from fcd0702c10ce574b887280476aba63d6682d5271 by zshen source checksum e9ec74ea3ff7bc9f3d35e9cac694fb",
  timeline-service-version-built-on: "2015-05-13T19:45Z",
  hadoop-version: "3.0.0-SNAPSHOT",
  hadoop-build-version: "3.0.0-SNAPSHOT from fcd0702c10ce574b887280476aba63d6682d5271 by zshen source checksum 95874b192923b43cdb96a6e483afd60",
  hadoop-version-built-on: "2015-05-13T19:44Z"
}
HTTP 要求
GET https://127.0.0.1:8188/ws/v1/applicationhistory/about
Accept: application/xml
回應標頭
HTTP/1.1 200 OK
Content-Type: application/xml
Content-Length: 748
回應本文
 <?xml version="1.0" encoding="UTF-8" standalone="yes"?>
 <about>
   <About>Generic History Service API</About>
   <hadoop-build-version>3.0.0-SNAPSHOT from fcd0702c10ce574b887280476aba63d6682d5271 by zshen source checksum 95874b192923b43cdb96a6e483afd60</hadoop-build-version>
   <hadoop-version>3.0.0-SNAPSHOT</hadoop-version>
   <hadoop-version-built-on>2015-05-13T19:44Z</hadoop-version-built-on>
   <timeline-service-build-version>3.0.0-SNAPSHOT from fcd0702c10ce574b887280476aba63d6682d5271 by zshen source checksum e9ec74ea3ff7bc9f3d35e9cac694fb</timeline-service-build-version>
   <timeline-service-version>3.0.0-SNAPSHOT</timeline-service-version>
   <timeline-service-version-built-on>2015-05-13T19:45Z</timeline-service-version-built-on>
 </about>
使用應用程式清單 API,您可以取得資源集合,其中每個資源都代表一個應用程式。當您對此資源執行 GET 作業時,您會取得應用程式物件集合。
http(s)://<timeline server http(s) address:port>/ws/v1/applicationhistory/apps
GET
states - 與指定的應用程式狀態相符的應用程式,以逗號分隔的清單表示
finalStatus - 應用程式的最終狀態 - 由應用程式本身報告
user - 使用者名稱
queue - 佇列名稱
limit - 要傳回的應用程式物件總數
startedTimeBegin - 起始時間為此時間的應用程式,以自紀元以來的毫秒數表示
startedTimeEnd - 起始時間結束於此時間的應用程式,以自紀元以來的毫秒數表示
finishedTimeBegin - 完成時間為此時間的應用程式,以自紀元以來的毫秒數表示
finishedTimeEnd - 完成時間結束於此時間的應用程式,以自紀元以來的毫秒數表示
applicationTypes - 與給定應用程式類型相符的應用程式,以逗號分隔的清單表示
apps (應用程式清單) 物件的元素當您要求應用程式清單時,資訊會以應用程式物件集合的形式傳回。另請參閱 Application 以了解應用程式物件的語法。
| 項目 | 資料類型 | 說明 |
|---|---|---|
app |
app 物件陣列 (JSON)/零個或多個應用程式物件 (XML) | 應用程式物件集合 |
HTTP 要求
GET http://<timeline server http address:port>/ws/v1/applicationhistory/apps
回應標頭
HTTP/1.1 200 OK
Content-Type: application/json
Transfer-Encoding: chunked
回應本文
{
  "app":
  [
      {
      "appId":"application_1430424020775_0004",
      "currentAppAttemptId":"appattempt_1430424020775_0004_000001",
      "user":"zshen",
      "name":"DistributedShell",
      "queue":"default",
      "type":"YARN",
      "host":"d-69-91-129-173.dhcp4.washington.edu/69.91.129.173",
      "rpcPort":-1,
      "appState":"FINISHED",
      "progress":100.0,
      "diagnosticsInfo":"",
      "originalTrackingUrl":"N/A",
      "trackingUrl":"http://d-69-91-129-173.dhcp4.washington.edu:8088/proxy/application_1430424020775_0004/",
      "finalAppStatus":"SUCCEEDED",
      "submittedTime":1430425001004,
      "startedTime":1430425001004,
      "finishedTime":1430425008861,
      "elapsedTime":7857,
      "unmanagedApplication":"false",
      "applicationPriority":0,
      "appNodeLabelExpression":"",
      "amNodeLabelExpression":""
      },
      {
      "appId":"application_1430424020775_0003",
      "currentAppAttemptId":"appattempt_1430424020775_0003_000001",
      "user":"zshen",
      "name":"DistributedShell",
      "queue":"default",
      "type":"YARN",
      "host":"d-69-91-129-173.dhcp4.washington.edu/69.91.129.173",
      "rpcPort":-1,
      "appState":"FINISHED",
      "progress":100.0,
      "diagnosticsInfo":"",
      "originalTrackingUrl":"N/A",
      "trackingUrl":"http://d-69-91-129-173.dhcp4.washington.edu:8088/proxy/application_1430424020775_0003/",
      "finalAppStatus":"SUCCEEDED",
      "submittedTime":1430424956650,
      "startedTime":1430424956650,
      "finishedTime":1430424963907,
      "elapsedTime":7257,
      "unmanagedApplication":"false",
      "applicationPriority":0,
      "appNodeLabelExpression":"",
      "amNodeLabelExpression":""
      },
      {
      "appId":"application_1430424020775_0002",
      "currentAppAttemptId":"appattempt_1430424020775_0002_000001",
      "user":"zshen",
      "name":"DistributedShell",
      "queue":"default",
      "type":"YARN",
      "host":"d-69-91-129-173.dhcp4.washington.edu/69.91.129.173",
      "rpcPort":-1,
      "appState":"FINISHED",
      "progress":100.0,
      "diagnosticsInfo":"",
      "originalTrackingUrl":"N/A",
      "trackingUrl":"http://d-69-91-129-173.dhcp4.washington.edu:8088/proxy/application_1430424020775_0002/",
      "finalAppStatus":"SUCCEEDED",
      "submittedTime":1430424769395,
      "startedTime":1430424769395,
      "finishedTime":1430424776594,
      "elapsedTime":7199,
      "unmanagedApplication":"false",
      "applicationPriority":0,
      "appNodeLabelExpression":"",
      "amNodeLabelExpression":""
      },
      {
      "appId":"application_1430424020775_0001",
      "currentAppAttemptId":"appattempt_1430424020775_0001_000001",
      "user":"zshen",
      "name":"QuasiMonteCarlo",
      "queue":"default",
      "type":"MAPREDUCE",
      "host":"localhost",
      "rpcPort":56264,
      "appState":"FINISHED",
      "progress":100.0,
      "diagnosticsInfo":"",
      "originalTrackingUrl":"http://d-69-91-129-173.dhcp4.washington.edu:19888/jobhistory/job/job_1430424020775_0001",
      "trackingUrl":"http://d-69-91-129-173.dhcp4.washington.edu:8088/proxy/application_1430424020775_0001/",
      "finalAppStatus":"SUCCEEDED",
      "submittedTime":1430424053809,
      "startedTime":1430424072153,
      "finishedTime":1430424776594,
      "elapsedTime":18344,
      "applicationTags":"mrapplication,ta-example",
      "unmanagedApplication":"false",
      "applicationPriority":0,
      "appNodeLabelExpression":"",
      "amNodeLabelExpression":""
      }
  ]
}
HTTP 要求
GET https://127.0.0.1:8188/ws/v1/applicationhistory/apps
回應標頭
HTTP/1.1 200 OK
Content-Type: application/xml
Content-Length: 1710
回應本文
<?xml version="1.0" encoding="UTF-8" standalone="yes"?>
<apps>
  <app>
    <appId>application_1430424020775_0004</appId>
    <currentAppAttemptId>appattempt_1430424020775_0004_000001</currentAppAttemptId>
    <user>zshen</user>
    <name>DistributedShell</name>
    <queue>default</queue>
    <type>YARN</type>
    <host>d-69-91-129-173.dhcp4.washington.edu/69.91.129.173</host>
    <rpcPort>-1</rpcPort>
    <appState>FINISHED</appState>
    <progress>100.0</progress>
    <diagnosticsInfo></diagnosticsInfo>
    <originalTrackingUrl>N/A</originalTrackingUrl>
    <trackingUrl>http://d-69-91-129-173.dhcp4.washington.edu:8088/proxy/application_1430424020775_0004/</trackingUrl>
    <finalAppStatus>SUCCEEDED</finalAppStatus>
    <submittedTime>1430425001004</submittedTime>
    <startedTime>1430425001004</startedTime>
    <finishedTime>1430425008861</finishedTime>
    <elapsedTime>7857</elapsedTime>
    <unmanagedApplication>false</unmanagedApplication>
    <applicationPriority>0</applicationPriority>
    <appNodeLabelExpression></appNodeLabelExpression>
    <amNodeLabelExpression></amNodeLabelExpression>
  </app>
  <app>
    <appId>application_1430424020775_0003</appId>
    <currentAppAttemptId>appattempt_1430424020775_0003_000001</currentAppAttemptId>
    <user>zshen</user>
    <name>DistributedShell</name>
    <queue>default</queue>
    <type>YARN</type>
    <host>d-69-91-129-173.dhcp4.washington.edu/69.91.129.173</host>
    <rpcPort>-1</rpcPort>
    <appState>FINISHED</appState>
    <progress>100.0</progress>
    <diagnosticsInfo></diagnosticsInfo>
    <originalTrackingUrl>N/A</originalTrackingUrl>
    <trackingUrl>http://d-69-91-129-173.dhcp4.washington.edu:8088/proxy/application_1430424020775_0003/</trackingUrl>
    <finalAppStatus>SUCCEEDED</finalAppStatus>
    <submittedTime>1430424956650</submittedTime>
    <startedTime>1430424956650</startedTime>
    <finishedTime>1430424963907</finishedTime>
    <elapsedTime>7257</elapsedTime>
    <unmanagedApplication>false</unmanagedApplication>
    <applicationPriority>0</applicationPriority>
    <appNodeLabelExpression></appNodeLabelExpression>
    <amNodeLabelExpression></amNodeLabelExpression>
  </app>
  <app>
    <appId>application_1430424020775_0002</appId>
    <currentAppAttemptId>appattempt_1430424020775_0002_000001</currentAppAttemptId>
    <user>zshen</user>
    <name>DistributedShell</name>
    <queue>default</queue>
    <type>YARN</type>
    <host>d-69-91-129-173.dhcp4.washington.edu/69.91.129.173</host>
    <rpcPort>-1</rpcPort>
    <appState>FINISHED</appState>
    <progress>100.0</progress>
    <diagnosticsInfo></diagnosticsInfo>
    <originalTrackingUrl>N/A</originalTrackingUrl>
    <trackingUrl>http://d-69-91-129-173.dhcp4.washington.edu:8088/proxy/application_1430424020775_0002/</trackingUrl>
    <finalAppStatus>SUCCEEDED</finalAppStatus>
    <submittedTime>1430424769395</submittedTime>
    <startedTime>1430424769395</startedTime>
    <finishedTime>1430424776594</finishedTime>
    <elapsedTime>7199</elapsedTime>
    <unmanagedApplication>false</unmanagedApplication>
    <applicationPriority>0</applicationPriority>
    <appNodeLabelExpression></appNodeLabelExpression>
    <amNodeLabelExpression></amNodeLabelExpression>
  </app>
  <app>
    <appId>application_1430424020775_0001</appId>
    <currentAppAttemptId>appattempt_1430424020775_0001_000001</currentAppAttemptId>
    <user>zshen</user>
    <name>QuasiMonteCarlo</name>
    <queue>default</queue>
    <type>MAPREDUCE</type>
    <host>localhost</host>
    <rpcPort>56264</rpcPort>
    <appState>FINISHED</appState>
    <progress>100.0</progress>
    <diagnosticsInfo></diagnosticsInfo>
    <originalTrackingUrl>http://d-69-91-129-173.dhcp4.washington.edu:19888/jobhistory/job/job_1430424020775_0001</originalTrackingUrl>
    <trackingUrl>http://d-69-91-129-173.dhcp4.washington.edu:8088/proxy/application_1430424020775_0001/</trackingUrl>
    <finalAppStatus>SUCCEEDED</finalAppStatus>
    <submittedTime>1430424053809</submittedTime>
    <startedTime>1430424053809</startedTime>
    <finishedTime>1430424072153</finishedTime>
    <elapsedTime>18344</elapsedTime>
    <applicationTags>mrapplication,ta-example</applicationTags>
    <unmanagedApplication>false</unmanagedApplication>
    <applicationPriority>0</applicationPriority>
    <appNodeLabelExpression></appNodeLabelExpression>
    <amNodeLabelExpression></amNodeLabelExpression>
  </app>
</apps>
使用應用程式 API,您可以取得應用程式資源,其中包含在 YARN 集群上執行的特定應用程式的資訊。
它基本上是 YARN ApplicationReport 結構的 XML/JSON 序列化形式。
使用下列 URI 取得由 appid 值識別的應用程式物件。
http(s)://<timeline server http(s) address:port>/ws/v1/applicationhistory/apps/{appid}
GET
無
app (應用程式) 物件的元素| 項目 | 資料類型 | 說明 |
|---|---|---|
appId |
字串 | 應用程式 ID |
user |
字串 | 啟動應用程式的使用者 |
name |
字串 | 應用程式名稱 |
type |
字串 | 應用程式類型 |
queue |
字串 | 應用程式提交到的佇列 |
appState |
字串 | 根據 ResourceManager 的應用程式狀態 - 有效值是 YarnApplicationState 列舉的成員:FINISHED、FAILED、KILLED |
finalStatus |
字串 | 如果已完成,應用程式的最終狀態 - 由應用程式本身報告 - 有效值為:UNDEFINED、SUCCEEDED、FAILED、KILLED |
progress |
浮點數 | 應用程式進度報告,以百分比表示。長駐的 YARN 服務可能無法提供有意義的值,或將其用作實際與所需容器數量的指標 |
trackingUrl |
字串 | 應用程式 (經由 RM Proxy) 的 Web URL |
originalTrackingUrl |
字串 | 應用程式的實際 Web URL |
diagnosticsInfo |
字串 | 已完成應用程式的詳細診斷資訊 |
startedTime |
長整數 | 應用程式開始時間 (自紀元以來的毫秒數) |
finishedTime |
長整數 | 應用程式結束時間 (自紀元以來的毫秒數) |
elapsedTime |
長整數 | 自應用程式開始以來的經過時間 (毫秒) |
allocatedMB |
int | 配置給應用程式執行中容器的記憶體總和 (MB) |
allocatedVCores |
int | 配置給應用程式執行中容器的虛擬核心總和 |
currentAppAttemptId |
字串 | 最新的應用程式嘗試 ID |
host |
字串 | ApplicationMaster 的主機 |
rpcPort |
int | ApplicationMaster 的 RPC 埠;如果未宣告 IPC 服務,則為零 |
applicationTags |
字串 | 應用程式標籤。 |
unmanagedApplication |
boolean | 應用程式是否為非受控。 |
applicationPriority |
int | 提交的應用程式優先順序。 |
appNodeLabelExpression |
字串 | 節點標籤表達式,用於識別預設情況下應用程式容器預期執行的節點。 |
amNodeLabelExpression |
字串 | 節點標籤表達式,用於識別預期執行應用程式 AM 容器的節點。 |
HTTP 要求
https://127.0.0.1:8188/ws/v1/applicationhistory/apps/application_1430424020775_0001
回應標頭
HTTP/1.1 200 OK
Content-Type: application/json
Transfer-Encoding: chunked
回應本文
{
  "appId": "application_1430424020775_0001",
  "currentAppAttemptId": "appattempt_1430424020775_0001_000001",
  "user": "zshen",
  "name": "QuasiMonteCarlo",
  "queue": "default",
  "type": "MAPREDUCE",
  "host": "localhost",
  "rpcPort": 56264,
  "appState": "FINISHED",
  "progress": 100.0,
  "diagnosticsInfo": "",
  "originalTrackingUrl": "http://d-69-91-129-173.dhcp4.washington.edu:19888/jobhistory/job/job_1430424020775_0001",
  "trackingUrl": "http://d-69-91-129-173.dhcp4.washington.edu:8088/proxy/application_1430424020775_0001/",
  "finalAppStatus": "SUCCEEDED",
  "submittedTime": 1430424053809,
  "startedTime": 1430424053809,
  "finishedTime": 1430424072153,
  "elapsedTime": 18344,
  "applicationTags": mrapplication,tag-example,
  "unmanagedApplication": "false",
  "applicationPriority": 0,
  "appNodeLabelExpression": "",
  "amNodeLabelExpression": ""
}
HTTP 要求
GET https://127.0.0.1:8188/ws/v1/applicationhistory/apps/application_1430424020775_0001
Accept: application/xml
回應標頭
HTTP/1.1 200 OK
Content-Type: application/xml
Content-Length: 873
回應本文
 <?xml version="1.0" encoding="UTF-8" standalone="yes"?>
 <app>
   <appId>application_1430424020775_0001</appId>
   <currentAppAttemptId>appattempt_1430424020775_0001_000001</currentAppAttemptId>
   <user>zshen</user>
   <name>QuasiMonteCarlo</name>
   <queue>default</queue>
   <type>MAPREDUCE</type>
   <host>localhost</host>
   <rpcPort>56264</rpcPort>
   <appState>FINISHED</appState>
   <progress>100.0</progress>
   <diagnosticsInfo></diagnosticsInfo>
   <originalTrackingUrl>http://d-69-91-129-173.dhcp4.washington.edu:19888/jobhistory/job/job_1430424020775_0001</originalTrackingUrl>
   <trackingUrl>http://d-69-91-129-173.dhcp4.washington.edu:8088/proxy/application_1430424020775_0001/</trackingUrl>
   <finalAppStatus>SUCCEEDED</finalAppStatus>
   <submittedTime>1430424053809</submittedTime>
   <startedTime>1430424053809</startedTime>
   <finishedTime>1430424072153</finishedTime>
   <elapsedTime>18344</elapsedTime>
   <applicationTags>mrapplication,ta-example</applicationTags>
   <unmanagedApplication>false</unmanagedApplication>
   <applicationPriority>0</applicationPriority>
   <appNodeLabelExpression><appNodeLabelExpression>
   <amNodeLabelExpression><amNodeLabelExpression>
 </app>
使用應用程式嘗試清單 API,您可以取得資源集合,其中每個資源都代表一個應用程式嘗試。當您對此資源執行 GET 作業時,您會取得應用程式嘗試物件集合。
使用下列 URI 取得由 appid 值識別的應用程式的全部嘗試物件。
http(s)://<timeline server http(s) address:port>/ws/v1/applicationhistory/apps/{appid}/appattempts
GET
無
appattempts (應用程式嘗試清單) 物件的元素當您要求取得應用程式嘗試清單時,資訊將以應用程式嘗試物件集合的形式傳回。請參閱 應用程式嘗試 以取得應用程式嘗試物件的語法。
| 項目 | 資料類型 | 說明 |
|---|---|---|
appattempt |
appattempt 物件陣列 (JSON)/零個或多個應用程式嘗試物件 (XML) | 應用程式嘗試物件集合 |
HTTP 要求
GET https://127.0.0.1:8188/ws/v1/applicationhistory/apps/application_1430424020775_0001/appattempts
回應標頭
HTTP/1.1 200 OK
Content-Type: application/json
Transfer-Encoding: chunked
回應本文
{
  "appAttempt": [
    {
      "appAttemptId": "appattempt_1430424020775_0001_000001",
      "host": "localhost",
      "rpcPort": 56264,
      "trackingUrl": "http://d-69-91-129-173.dhcp4.washington.edu:8088/proxy/application_1430424020775_0001/",
      "originalTrackingUrl": "http://d-69-91-129-173.dhcp4.washington.edu:19888/jobhistory/job/job_1430424020775_0001",
      "diagnosticsInfo": "",
      "appAttemptState": "FINISHED",
      "amContainerId": "container_1430424020775_0001_01_000001"
    }
  ]
}
HTTP 要求
GET https://127.0.0.1:8188/ws/v1/applicationhistory/apps/application_1430424020775_0001/appattempts
Accept: application/xml
回應標頭
HTTP/1.1 200 OK
Content-Type: application/xml
回應本文
<?xml version="1.0" encoding="UTF-8" standalone="yes"?>
<appAttempts>
  <appAttempt>
    <appAttemptId>appattempt_1430424020775_0001_000001</appAttemptId>
    <host>localhost</host>
    <rpcPort>56264</rpcPort>
    <trackingUrl>http://d-69-91-129-173.dhcp4.washington.edu:8088/proxy/application_1430424020775_0001/</trackingUrl>
    <originalTrackingUrl>http://d-69-91-129-173.dhcp4.washington.edu:19888/jobhistory/job/job_1430424020775_0001</originalTrackingUrl>
    <diagnosticsInfo></diagnosticsInfo>
    <appAttemptState>FINISHED</appAttemptState>
    <amContainerId>container_1430424020775_0001_01_000001</amContainerId>
  </appAttempt>
</appAttempts>
使用應用程式嘗試 API,您可以取得應用程式嘗試資源,其中包含在 YARN 群集上執行的應用程式的特定應用程式嘗試資訊。
使用下列 URI 取得由 appid 值和 appattemptid 值識別的應用程式嘗試物件。
http(s)://<timeline server http(s) address:port>/ws/v1/applicationhistory/apps/{appid}/appattempts/{appattemptid}
GET
無
appattempt (應用程式嘗試) 物件的元素| 項目 | 資料類型 | 說明 |
|---|---|---|
appAttemptId |
字串 | 應用程式嘗試 ID |
amContainerId |
字串 | ApplicationMaster 容器 ID |
appAttemptState |
字串 | 根據 ResourceManager 的應用程式嘗試狀態 - 有效值是 YarnApplicationAttemptState 列舉的成員:已完成、失敗、已終止 |
trackingUrl |
字串 | 可使用來追蹤應用程式的網路 URL |
originalTrackingUrl |
字串 | 應用程式的實際 Web URL |
diagnosticsInfo |
字串 | 詳細診斷資訊 |
host |
字串 | ApplicationMaster 的主機 |
rpcPort |
int | ApplicationMaster 的 RPC 埠 |
HTTP 要求
https://127.0.0.1:8188/ws/v1/applicationhistory/apps/application_1430424020775_0001/appattempts/appattempt_1430424020775_0001_000001
回應標頭
HTTP/1.1 200 OK
Content-Type: application/json
Transfer-Encoding: chunked
回應本文
{
  "appAttemptId": "appattempt_1430424020775_0001_000001",
  "host": "localhost",
  "rpcPort": 56264,
  "trackingUrl": "http://d-69-91-129-173.dhcp4.washington.edu:8088/proxy/application_1430424020775_0001/",
  "originalTrackingUrl": "http://d-69-91-129-173.dhcp4.washington.edu:19888/jobhistory/job/job_1430424020775_0001",
  "diagnosticsInfo": "",
  "appAttemptState": "FINISHED",
  "amContainerId": "container_1430424020775_0001_01_000001"
}
HTTP 要求
GET http://<timeline server http address:port>/ws/v1/applicationhistory/apps/application_1395789200506_0001/appattempts/appattempt_1395789200506_0001_000001
Accept: application/xml
回應標頭
HTTP/1.1 200 OK
Content-Type: application/xml
Content-Length: 488
回應本文
<?xml version="1.0" encoding="UTF-8" standalone="yes"?>
<appAttempt>
  <appAttemptId>appattempt_1430424020775_0001_000001</appAttemptId>
  <host>localhost</host>
  <rpcPort>56264</rpcPort>
  <trackingUrl>http://d-69-91-129-173.dhcp4.washington.edu:8088/proxy/application_1430424020775_0001/</trackingUrl>
  <originalTrackingUrl>http://d-69-91-129-173.dhcp4.washington.edu:19888/jobhistory/job/job_1430424020775_0001</originalTrackingUrl>
  <diagnosticsInfo></diagnosticsInfo>
  <appAttemptState>FINISHED</appAttemptState>
  <amContainerId>container_1430424020775_0001_01_000001</amContainerId>
</appAttempt>
使用容器清單 API,您可以取得資源集合,每個資源都代表一個容器。當您對此資源執行 GET 作業時,您會取得容器物件集合。
使用下列 URI 取得由 appid 值和 appattemptid 值識別的應用程式嘗試的所有容器物件。
http(s)://<timeline server http(s) address:port>/ws/v1/applicationhistory/apps/{appid}/appattempts/{appattemptid}/containers
GET
無
containers (容器清單) 物件的元素當您要求取得容器清單時,資訊將以容器物件集合的形式傳回。另請參閱 Container 以取得容器物件的語法。
| 項目 | 資料類型 | 說明 |
|---|---|---|
container |
容器物件陣列 (JSON)/零個或多個容器物件 (XML) | 容器物件集合 |
HTTP 要求
GET https://127.0.0.1:8188/ws/v1/applicationhistory/apps/application_1430424020775_0001/appattempts/appattempt_1430424020775_0001_000001/containers?
回應標頭
HTTP/1.1 200 OK
Content-Type: application/json
Transfer-Encoding: chunked
回應本文
{
  "container": [
    {
      "containerId": "container_1430424020775_0001_01_000007",
      "allocatedMB": 1024,
      "allocatedVCores": 1,
      "assignedNodeId": "localhost:9105",
      "priority": 10,
      "startedTime": 1430424068296,
      "finishedTime": 1430424073006,
      "elapsedTime": 4710,
      "diagnosticsInfo": "Container killed by the ApplicationMaster.\nContainer killed on request. Exit code is 143\nContainer exited with a non-zero exit code 143\n",
      "logUrl": "http://0.0.0.0:8188/applicationhistory/logs/localhost:9105/container_1430424020775_0001_01_000007/container_1430424020775_0001_01_000007/zshen",
      "containerExitStatus": -105,
      "containerState": "COMPLETE",
      "nodeHttpAddress": "https://127.0.0.1:8042"
    },
    {
      "containerId": "container_1430424020775_0001_01_000006",
      "allocatedMB": 1024,
      "allocatedVCores": 1,
      "assignedNodeId": "localhost:9105",
      "priority": 20,
      "startedTime": 1430424060317,
      "finishedTime": 1430424068293,
      "elapsedTime": 7976,
      "diagnosticsInfo": "Container killed by the ApplicationMaster.\nContainer killed on request. Exit code is 143\nContainer exited with a non-zero exit code 143\n",
      "logUrl": "http://0.0.0.0:8188/applicationhistory/logs/localhost:9105/container_1430424020775_0001_01_000006/container_1430424020775_0001_01_000006/zshen",
      "containerExitStatus": -105,
      "containerState": "COMPLETE",
      "nodeHttpAddress": "https://127.0.0.1:8042"
    },
    {
      "containerId": "container_1430424020775_0001_01_000005",
      "allocatedMB": 1024,
      "allocatedVCores": 1,
      "assignedNodeId": "localhost:9105",
      "priority": 20,
      "startedTime": 1430424060316,
      "finishedTime": 1430424068294,
      "elapsedTime": 7978,
      "diagnosticsInfo": "Container killed by the ApplicationMaster.\nContainer killed on request. Exit code is 143\nContainer exited with a non-zero exit code 143\n",
      "logUrl": "http://0.0.0.0:8188/applicationhistory/logs/localhost:9105/container_1430424020775_0001_01_000005/container_1430424020775_0001_01_000005/zshen",
      "containerExitStatus": -105,
      "containerState": "COMPLETE",
      "nodeHttpAddress": "https://127.0.0.1:8042"
    },
    {
      "containerId": "container_1430424020775_0001_01_000003",
      "allocatedMB": 1024,
      "allocatedVCores": 1,
      "assignedNodeId": "localhost:9105",
      "priority": 20,
      "startedTime": 1430424060315,
      "finishedTime": 1430424068289,
      "elapsedTime": 7974,
      "diagnosticsInfo": "Container killed by the ApplicationMaster.\nContainer killed on request. Exit code is 143\nContainer exited with a non-zero exit code 143\n",
      "logUrl": "http://0.0.0.0:8188/applicationhistory/logs/localhost:9105/container_1430424020775_0001_01_000003/container_1430424020775_0001_01_000003/zshen",
      "containerExitStatus": -105,
      "containerState": "COMPLETE",
      "nodeHttpAddress": "https://127.0.0.1:8042"
    },
    {
      "containerId": "container_1430424020775_0001_01_000004",
      "allocatedMB": 1024,
      "allocatedVCores": 1,
      "assignedNodeId": "localhost:9105",
      "priority": 20,
      "startedTime": 1430424060315,
      "finishedTime": 1430424068291,
      "elapsedTime": 7976,
      "diagnosticsInfo": "Container killed by the ApplicationMaster.\nContainer killed on request. Exit code is 143\nContainer exited with a non-zero exit code 143\n",
      "logUrl": "http://0.0.0.0:8188/applicationhistory/logs/localhost:9105/container_1430424020775_0001_01_000004/container_1430424020775_0001_01_000004/zshen",
      "containerExitStatus": -105,
      "containerState": "COMPLETE",
      "nodeHttpAddress": "https://127.0.0.1:8042"
    },
    {
      "containerId": "container_1430424020775_0001_01_000002",
      "allocatedMB": 1024,
      "allocatedVCores": 1,
      "assignedNodeId": "localhost:9105",
      "priority": 20,
      "startedTime": 1430424060313,
      "finishedTime": 1430424067250,
      "elapsedTime": 6937,
      "diagnosticsInfo": "Container killed by the ApplicationMaster.\nContainer killed on request. Exit code is 143\nContainer exited with a non-zero exit code 143\n",
      "logUrl": "http://0.0.0.0:8188/applicationhistory/logs/localhost:9105/container_1430424020775_0001_01_000002/container_1430424020775_0001_01_000002/zshen",
      "containerExitStatus": -105,
      "containerState": "COMPLETE",
      "nodeHttpAddress": "https://127.0.0.1:8042"
    },
    {
      "containerId": "container_1430424020775_0001_01_000001",
      "allocatedMB": 2048,
      "allocatedVCores": 1,
      "assignedNodeId": "localhost:9105",
      "priority": 0,
      "startedTime": 1430424054314,
      "finishedTime": 1430424079022,
      "elapsedTime": 24708,
      "diagnosticsInfo": "",
      "logUrl": "http://0.0.0.0:8188/applicationhistory/logs/localhost:9105/container_1430424020775_0001_01_000001/container_1430424020775_0001_01_000001/zshen",
      "containerExitStatus": 0,
      "containerState": "COMPLETE",
      "nodeHttpAddress": "https://127.0.0.1:8042"
    }
  ]
}
HTTP 要求
GET https://127.0.0.1:8188/ws/v1/applicationhistory/apps/application_1430424020775_0001/appattempts/appattempt_1430424020775_0001_000001/containers
Accept: application/xml
回應標頭
  HTTP/1.1 200 OK
  Content-Type: application/xml
  Content-Length: 1428
回應本文
<?xml version="1.0" encoding="UTF-8" standalone="yes"?>
<containers>
  <container>
    <containerId>container_1430424020775_0001_01_000007</containerId>
    <allocatedMB>1024</allocatedMB>
    <allocatedVCores>1</allocatedVCores>
    <assignedNodeId>localhost:9105</assignedNodeId>
    <priority>10</priority>
    <startedTime>1430424068296</startedTime>
    <finishedTime>1430424073006</finishedTime>
    <elapsedTime>4710</elapsedTime>
    <diagnosticsInfo>Container killed by the ApplicationMaster.
      Container killed on request. Exit code is 143
      Container exited with a non-zero exit code 143
    </diagnosticsInfo>
    <logUrl>http://0.0.0.0:8188/applicationhistory/logs/localhost:9105/container_1430424020775_0001_01_000007/container_1430424020775_0001_01_000007/zshen</logUrl>
    <containerExitStatus>-105</containerExitStatus>
    <containerState>COMPLETE</containerState>
    <nodeHttpAddress>https://127.0.0.1:8042</nodeHttpAddress>
  </container>
  <container>
    <containerId>container_1430424020775_0001_01_000006</containerId>
    <allocatedMB>1024</allocatedMB>
    <allocatedVCores>1</allocatedVCores>
    <assignedNodeId>localhost:9105</assignedNodeId>
    <priority>20</priority>
    <startedTime>1430424060317</startedTime>
    <finishedTime>1430424068293</finishedTime>
    <elapsedTime>7976</elapsedTime>
    <diagnosticsInfo>Container killed by the ApplicationMaster.
      Container killed on request. Exit code is 143
      Container exited with a non-zero exit code 143
    </diagnosticsInfo>
    <logUrl>http://0.0.0.0:8188/applicationhistory/logs/localhost:9105/container_1430424020775_0001_01_000006/container_1430424020775_0001_01_000006/zshen</logUrl>
    <containerExitStatus>-105</containerExitStatus>
    <containerState>COMPLETE</containerState>
    <nodeHttpAddress>https://127.0.0.1:8042</nodeHttpAddress>
  </container>
  <container>
    <containerId>container_1430424020775_0001_01_000005</containerId>
    <allocatedMB>1024</allocatedMB>
    <allocatedVCores>1</allocatedVCores>
    <assignedNodeId>localhost:9105</assignedNodeId>
    <priority>20</priority>
    <startedTime>1430424060316</startedTime>
    <finishedTime>1430424068294</finishedTime>
    <elapsedTime>7978</elapsedTime>
    <diagnosticsInfo>Container killed by the ApplicationMaster.
      Container killed on request. Exit code is 143
      Container exited with a non-zero exit code 143
    </diagnosticsInfo>
    <logUrl>http://0.0.0.0:8188/applicationhistory/logs/localhost:9105/container_1430424020775_0001_01_000005/container_1430424020775_0001_01_000005/zshen</logUrl>
    <containerExitStatus>-105</containerExitStatus>
    <containerState>COMPLETE</containerState>
    <nodeHttpAddress>https://127.0.0.1:8042</nodeHttpAddress>
  </container>
  <container>
    <containerId>container_1430424020775_0001_01_000003</containerId>
    <allocatedMB>1024</allocatedMB>
    <allocatedVCores>1</allocatedVCores>
    <assignedNodeId>localhost:9105</assignedNodeId>
    <priority>20</priority>
    <startedTime>1430424060315</startedTime>
    <finishedTime>1430424068289</finishedTime>
    <elapsedTime>7974</elapsedTime>
    <diagnosticsInfo>Container killed by the ApplicationMaster.
      Container killed on request. Exit code is 143
      Container exited with a non-zero exit code 143
    </diagnosticsInfo>
    <logUrl>http://0.0.0.0:8188/applicationhistory/logs/localhost:9105/container_1430424020775_0001_01_000003/container_1430424020775_0001_01_000003/zshen</logUrl>
    <containerExitStatus>-105</containerExitStatus>
    <containerState>COMPLETE</containerState>
    <nodeHttpAddress>https://127.0.0.1:8042</nodeHttpAddress>
  </container>
  <container>
    <containerId>container_1430424020775_0001_01_000004</containerId>
    <allocatedMB>1024</allocatedMB>
    <allocatedVCores>1</allocatedVCores>
    <assignedNodeId>localhost:9105</assignedNodeId>
    <priority>20</priority>
    <startedTime>1430424060315</startedTime>
    <finishedTime>1430424068291</finishedTime>
    <elapsedTime>7976</elapsedTime>
    <diagnosticsInfo>Container killed by the ApplicationMaster.
      Container killed on request. Exit code is 143
      Container exited with a non-zero exit code 143
    </diagnosticsInfo>
    <logUrl>http://0.0.0.0:8188/applicationhistory/logs/localhost:9105/container_1430424020775_0001_01_000004/container_1430424020775_0001_01_000004/zshen</logUrl>
    <containerExitStatus>-105</containerExitStatus>
    <containerState>COMPLETE</containerState>
    <nodeHttpAddress>https://127.0.0.1:8042</nodeHttpAddress>
  </container>
  <container>
    <containerId>container_1430424020775_0001_01_000002</containerId>
    <allocatedMB>1024</allocatedMB>
    <allocatedVCores>1</allocatedVCores>
    <assignedNodeId>localhost:9105</assignedNodeId>
    <priority>20</priority>
    <startedTime>1430424060313</startedTime>
    <finishedTime>1430424067250</finishedTime>
    <elapsedTime>6937</elapsedTime>
    <diagnosticsInfo>Container killed by the ApplicationMaster.
      Container killed on request. Exit code is 143
      Container exited with a non-zero exit code 143
    </diagnosticsInfo>
    <logUrl>http://0.0.0.0:8188/applicationhistory/logs/localhost:9105/container_1430424020775_0001_01_000002/container_1430424020775_0001_01_000002/zshen</logUrl>
    <containerExitStatus>-105</containerExitStatus>
    <containerState>COMPLETE</containerState>
    <nodeHttpAddress>https://127.0.0.1:8042</nodeHttpAddress>
  </container>
  <container>
    <containerId>container_1430424020775_0001_01_000001</containerId>
    <allocatedMB>2048</allocatedMB>
    <allocatedVCores>1</allocatedVCores>
    <assignedNodeId>localhost:9105</assignedNodeId>
    <priority>0</priority>
    <startedTime>1430424054314</startedTime>
    <finishedTime>1430424079022</finishedTime>
    <elapsedTime>24708</elapsedTime>
    <diagnosticsInfo></diagnosticsInfo>
    <logUrl>http://0.0.0.0:8188/applicationhistory/logs/localhost:9105/container_1430424020775_0001_01_000001/container_1430424020775_0001_01_000001/zshen</logUrl>
    <containerExitStatus>0</containerExitStatus>
    <containerState>COMPLETE</containerState>
    <nodeHttpAddress>https://127.0.0.1:8042</nodeHttpAddress>
  </container>
</containers>
使用容器 API,您可以取得容器資源,其中包含在 YARN 群集上執行的應用程式的應用程式嘗試的特定容器資訊。
使用下列 URI 取得由 appid 值、appattemptid 值和 containerid 值識別的容器物件。
http(s)://<timeline server http(s) address:port>/ws/v1/applicationhistory/apps/{appid}/appattempts/{appattemptid}/containers/{containerid}
GET
無
container (容器) 物件的元素| 項目 | 資料類型 | 說明 |
|---|---|---|
containerId |
字串 | 容器 ID |
containerState |
字串 | 根據 ResourceManager 的容器狀態 - 有效值是 ContainerState 列舉的成員:已完成 |
containerExitStatus |
int | 容器退出狀態 |
logUrl |
字串 | 可存取容器彙總記錄的記錄網址 |
diagnosticsInfo |
字串 | 詳細診斷資訊 |
startedTime |
長整數 | 容器開始的時間 (自紀元以來的毫秒數) |
finishedTime |
長整數 | 容器結束的時間 (自紀元以來的毫秒數) |
elapsedTime |
長整數 | 容器自開始以來經過的時間 (毫秒數) |
allocatedMB |
int | 分配給容器的記憶體 (MB) |
allocatedVCores |
int | 分配給容器的虛擬核心數 |
priority |
int | 容器的優先順序 |
assignedNodeId |
字串 | 容器所分配的節點主機和埠 |
HTTP 要求
GET https://127.0.0.1:8188/ws/v1/applicationhistory/apps/application_1430424020775_0001/appattempts/appattempt_1430424020775_0001_000001/containers/container_1430424020775_0001_01_000001
回應標頭
HTTP/1.1 200 OK
Content-Type: application/json
Transfer-Encoding: chunked
回應本文
{
  "containerId": "container_1430424020775_0001_01_000001",
  "allocatedMB": 2048,
  "allocatedVCores": 1,
  "assignedNodeId": "localhost:9105",
  "priority": 0,
  "startedTime": 1430424054314,
  "finishedTime": 1430424079022,
  "elapsedTime": 24708,
  "diagnosticsInfo": "",
  "logUrl": "http://0.0.0.0:8188/applicationhistory/logs/localhost:9105/container_1430424020775_0001_01_000001/container_1430424020775_0001_01_000001/zshen",
  "containerExitStatus": 0,
  "containerState": "COMPLETE",
  "nodeHttpAddress": "https://127.0.0.1:8042"
}
HTTP 要求
GET https://127.0.0.1:8188/ws/v1/applicationhistory/apps/application_1430424020775_0001/appattempts/appattempt_1430424020775_0001_000001/containers/container_1430424020775_0001_01_000001
Accept: application/xml
回應標頭
HTTP/1.1 200 OK
Content-Type: application/xml
Content-Length: 669
回應本文
<?xml version="1.0" encoding="UTF-8" standalone="yes"?>
<container>
  <containerId>container_1430424020775_0001_01_000001</containerId>
  <allocatedMB>2048</allocatedMB>
  <allocatedVCores>1</allocatedVCores>
  <assignedNodeId>localhost:9105</assignedNodeId>
  <priority>0</priority>
  <startedTime>1430424054314</startedTime>
  <finishedTime>1430424079022</finishedTime>
  <elapsedTime>24708</elapsedTime>
  <diagnosticsInfo></diagnosticsInfo>
  <logUrl>http://0.0.0.0:8188/applicationhistory/logs/localhost:9105/container_1430424020775_0001_01_000001/container_1430424020775_0001_01_000001/zshen</logUrl>
  <containerExitStatus>0</containerExitStatus>
  <containerState>COMPLETE</containerState>
  <nodeHttpAddress>https://127.0.0.1:8042</nodeHttpAddress>
</container>
時間軸伺服器效能測試工具有助於衡量時間軸伺服器的寫入效能。測試會啟動 SimpleEntityWriter 映射器或 JobHistoryFileReplay 映射器,將時間軸實體寫入時間軸伺服器。最後,系統會衡量每個映射器的交易率 (ops/s) 和總交易率,並將其列印出來。使用 SimpleEntityWriter 映射器執行測試時,還會衡量每個映射器的 IO 率 (KB/s) 和總 IO 率。
映射器類型說明
選項
[-m <maps>] number of mappers (default: 1)
[-v] timeline service version
[-mtype <mapper type in integer>]
      1. simple entity write mapper (default)
      2. jobhistory files replay mapper
[-s <(KBs)test>] number of KB per put (mtype=1, default: 1 KB)
[-t] package sending iterations per mapper (mtype=1, default: 100)
[-d <path>] root path of job history files (mtype=2)
[-r <replay mode>] (mtype=2)
      1. write all entities for a job in one put (default)
      2. write one entity at a time
執行 SimpleEntityWriter 測試
bin/hadoop jar performanceTest.jar timelineperformance -m 4 -mtype 1 -s 3 -t 200
SimpleEntityWriter 測試的範例輸出
TRANSACTION RATE (per mapper): 20000.0 ops/s
IO RATE (per mapper): 60000.0 KB/s
TRANSACTION RATE (total): 80000.0 ops/s
IO RATE (total): 240000.0 KB/s
執行 JobHistoryFileReplay 對應程式測試
$ bin/hadoop jar performanceTest.jar timelineperformance -m 2 -mtype 2 -d /testInput -r 2
JobHistoryFileReplay 對應程式測試的範例輸入
$ bin/hadoop fs -ls /testInput
/testInput/job_1.jhist
/testInput/job_1_conf.xml
/testInput/job_2.jhist
/testInput/job_2_conf.xml
JobHistoryFileReplay 測試的範例輸出
TRANSACTION RATE (per mapper): 4000.0 ops/s
IO RATE (per mapper): 0.0 KB/s
TRANSACTION RATE (total): 8000.0 ops/s
IO RATE (total): 0.0 KB/s